


Quick answer
In a 2019 study of shopping websites, researchers classified 157 of 393 detected countdown timers as deceptive under their repeated-check rule. The reconstructed share is 39.95%. A store can check the same failure mode by verifying that the offer actually stops applying at checkout when the timer ends.
Key findings and sources
39.95% of observed countdown timers met the study’s deception rule
Mathur and colleagues classified 157 of 393 observed countdown timer instances as deceptive, equivalent to 39.95%. The 2019 study’s rule included resets with the same offer still valid and expiry without the offer ending.
Mathur et al., Dark Patterns at Scale
Urgency and scarcity made up 63.81% of detected instances
The four urgency and scarcity categories in Mathur and colleagues’ Table 1 sum to 1,160 of the 1,818 detected pattern instances, or 63.81%. Counts refer to observed instances and can include several on one site.
Mathur et al., Dark Patterns at Scale
Eight sites appeared in both urgency categories
The crawl reported 361 sites with countdown timers, 84 sites with limited-time messages and 437 sites with either. Subtracting the combined union from the two counts gives eight sites with both.
Mathur et al., Dark Patterns at Scale
Repeated checks distinguished timers from static text
In the historical shopping-site study, the researchers revisited selected dynamic patterns once every four hours for five days. The follow-up could detect an offer still applying after a timer expired.
Mathur et al., Dark Patterns at Scale
More than four in five observed demand messages were invariant across items
Mathur et al. found that 38 of 47 detected high-demand message instances appeared regardless of the product shown or the items in the cart. The reconstructed share is 80.85% for that pattern type in the historical crawl.
Mathur et al., Dark Patterns at Scale
High-demand messages detected in the 2019 shopping-site study. Divide the 38 consistently appearing instances by the 47 detected high-demand instances.
Fifteen sites appeared in both reported scarcity categories
The 2019 crawl reported 581 sites with low-stock messages, 43 with high-demand messages and 609 with either. The implied overlap is 15 sites.
Mathur et al., Dark Patterns at Scale
Site-level counts across the two scarcity categories in the same historical crawl. Add both category counts and subtract the published union.
Compare the results
An expiry promise has to survive the checkout
A shopper sees a timer, opens checkout and expects the discount to end when the timer reaches zero. A useful test checks the cart total on both sides of that moment. It also tests reopening the page, switching devices and opening a recovery message later. The same offer needs one authoritative end time.
Mathur and colleagues revisited dynamic patterns every four hours for five days. They classified a timer as deceptive when it reset with the same offer still valid or when the offer remained valid after expiry. In their crawl, 157 of 393 detected timers met that rule. That 39.95% applies to the timers they observed. The method did not measure how many orders a valid or invalid timer produces.
Timers and scarcity messages fail in different ways
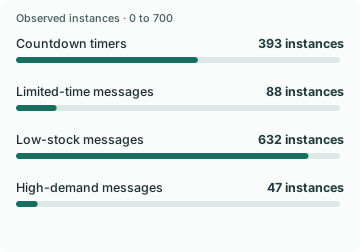
The paper identified 393 countdown timers, 88 limited-time messages, 632 low-stock messages and 47 high-demand messages. The four counts sum to 1,160, or 63.81% of all 1,818 detected pattern instances. A single store could contribute several instances, so the percentage describes the mix the researchers detected.
A timer can be tested with the time and final checkout total. A low-stock message requires the stock count of the exact variant and market. A high-demand claim needs a defined measure and time window. If the brand can only verify a sale end date, use that date and drop the unsupported stock or demand claim.
Keep the offer promise the same in the follow-up
When a shopper replies after the sale ends, confirm the current price and let them decide. An expired offer does not automatically restart because a message was opened. If support can offer an exception, define who is eligible and make sure the checkout accepts it before a reply promises it.
Test at least three states in your own store. Open a qualifying cart before the deadline, revisit it after the deadline, and change a quantity or variant after the deadline. Record whether the price and eligibility agree across the cart, checkout and follow-up. If the three surfaces disagree, fix the offer source before experimenting with urgency copy.
A demand label that never changes is a different failure from a reset timer
Mathur and colleagues observed 47 high-demand messages, and 38 appeared consistently regardless of the product or cart contents. That is 80.85% of the observed instances of this message type. The same paper recorded 609 sites with low-stock or high-demand messages. Since the two type-specific counts were 581 and 43 sites, they imply 15 sites with both patterns.
Neither calculation tells a store how often a current competitor exaggerates demand. The first describes a detection pattern under the authors’ historical crawl. The second describes overlap between two categories of site text. A timer that restarts, a generic demand label and a precise inventory promise need different verification tests.
Check what changes when the item, the quantity or the deadline changes
A product-specific popularity message should respond to the item and time window it describes. Check the data source that supplies the claim, then compare several products with different demand. A true stock warning should follow the quantity that can actually be sold in the shopper’s market. A countdown should be driven by a deadline that the checkout enforces.
If a recovery message carries the claim, read the authoritative value at send time and verify it again if the shopper replies later. A legitimately low quantity can change while a conversation is open. The useful response may simply report current availability without pressuring the buyer. Record the evidence that supported each statement so the team can investigate any discrepancy.
Study data
| Measure | Value | Context |
|---|---|---|
| Countdown timers, instances | 393 instances | A type-specific count |
| Countdown timers, sites | 361 sites | Sites can occur in more than one row |
| Limited-time messages, instances | 88 instances | A type-specific count |
| Limited-time messages, sites | 84 sites | Sites can occur in more than one row |
| Low-stock messages, instances | 632 instances | A type-specific count |
| Low-stock messages, sites | 581 sites | Sites can occur in more than one row |
| High-demand messages, instances | 47 instances | A type-specific count |
| High-demand messages, sites | 43 sites | Sites can occur in more than one row |
| All detected pattern instances | 1,818 instances | Published crawl or monitoring count |
| Sites with at least one detected pattern | 1,254 sites | Published crawl or monitoring count |
| Sites with either urgency pattern | 437 sites | Published crawl or monitoring count |
| Timers classified as deceptive | 157 instances | Published crawl or monitoring count |
| Sites with a timer classified as deceptive | 140 sites | Published crawl or monitoring count |
| Duration of the follow-up monitoring | 5 days | Published crawl or monitoring count |
| Time between follow-up checks | 4 hours | Published crawl or monitoring count |
| High-demand messages appearing regardless of product or cart | 38 instances | Reported invariant message instances |
| Sites with either low-stock or high-demand messages | 609 sites | Published category union |
What changes when you compare the figures
| Comparison | Result | Calculation |
|---|---|---|
| Urgency and scarcity instances combined | 1,160 instances | = 393 + 88 + 632 + 47 |
| Combined share of all detected pattern instances | 63.81% | = (393 + 88 + 632 + 47) / 1818 * 100 |
| Observed timers classified as deceptive | 39.95% | = 157 / 393 * 100 |
| Sites that had both urgency pattern types | 8 sites | = 361 + 84 - 437 |
| Deceptive timer sites as a share of sites with observed timers | 38.78% | = 140 / 361 * 100 |
| High-demand messages invariant across items | 80.851% | = 38 / 47 * 100 |
| Sites appearing in both scarcity categories | 15 sites | = 581 + 43 - 609 |
| Share of high-demand sites also showing low-stock messages | 34.884% | = 15 / 43 * 100 |
Methodology and sources
Use the instance counts and site counts separately from the paper’s Table 1 and Section 5.1.2. Sum the two urgency and two scarcity instance categories to obtain 1,160. Divide by all 1,818 detected instances to describe the audited mix. The deceptive timer share divides 157 classified instances by 393 detected timers. The two website counts can overlap, so calculate their overlap against the separately reported union of 437 sites.
Download the source data (CSV)
Download the calculations (CSV)
Related reading
Online discount statistics from a 314-trader pricing sweep
Shopping cart coupon statistics from Alibaba’s randomized promotion study
Equal-Value Checkout Promotions Can Get Different Responses
Check the real price before you promise two Shopify discounts
Sources and definitions
Mathur et al., Dark Patterns at Scale
The source data includes the population, period, denominator and limitations for every figure.