


Quick answer
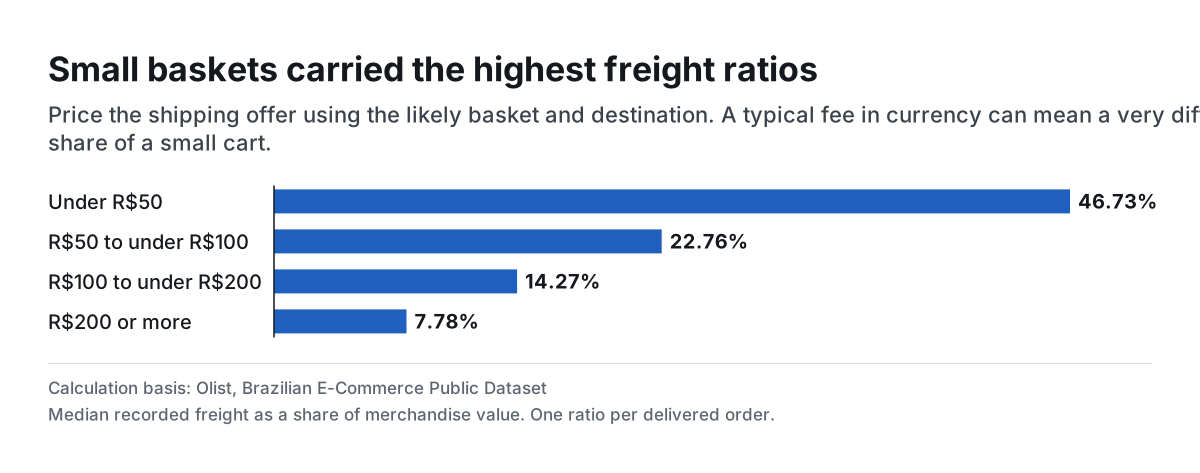
In the Olist delivered-order cohort, median recorded freight was 46.73% of merchandise value for baskets under R$50, versus 7.78% for baskets of R$200 or more. Freight reached at least half of merchandise value on 45.33% of under-R$50 orders. These are historical freight records, not abandonment rates.
Key findings and sources
Small-basket median freight ratios were nearly half of merchandise value
In Said Maybe’s Olist reanalysis, median recorded freight equaled 46.73% of item value for delivered orders under R$50, versus 7.78% for orders of R$200 or more.
Olist, Brazilian E-Commerce Public Dataset
89,860 delivered Olist orders purchased January 2017 through July 2018 with positive summed item price Compute freight/merchandise per order and take separate basket-band medians.
More than 12,000 small orders had freight of at least half the item value
Among 26,728 eligible Olist delivered orders under R$50, 12,115 (45.33%) recorded freight equal to at least half of merchandise value.
Olist, Brazilian E-Commerce Public Dataset
89,860 delivered Olist orders purchased January 2017 through July 2018 with positive summed item price Count order-level freight values where 2 × freight is at least total item price.
One-quarter freight was much more common on small baskets
In the Olist cohort, 90.5% of delivered orders under R$50 had freight of at least one-quarter of item value, versus 7.58% of orders of R$200 or more.
Olist, Brazilian E-Commerce Public Dataset
89,860 delivered Olist orders purchased January 2017 through July 2018 with positive summed item price Divide threshold counts by eligible delivered orders within each basket band.
Higher currency freight did not mean a higher relative burden
In the Olist delivered-order cohort, median recorded freight was R$15.10 below R$50 merchandise value and R$26.70 at R$200 or more, while the median individual freight ratios moved in the opposite direction.
Olist, Brazilian E-Commerce Public Dataset
89,860 delivered Olist orders purchased January 2017 through July 2018 with positive summed item price Take separate medians of order-level freight amount and order-level freight-to-item-value ratios.
Compare the results
Small baskets carried the highest freight ratios
Price the shipping offer using the likely basket and destination. A typical fee in currency can mean a very different share of a small cart.
The same shipping fee means something different on a smaller basket
Under-R$50 delivered orders had a median freight value of R$15.10. Orders at R$200 or above had a higher median freight value of R$26.70. Yet freight relative to the individual order’s item value was much higher in the smaller basket band.
These are separate views of the same order data. A fee can cost more in currency on a large cart while representing a smaller part of the purchase. Divide each order’s freight by its item total first, then summarize the resulting ratios. Dividing the median fee by the median basket is a different calculation.
Inspect the expensive tail alongside the typical cart
Of 26,728 delivered orders under R$50, 12,115 had recorded freight at least half the merchandise value. The same condition applied to 112 of 13,714 baskets worth at least R$200. The example shows why quoting a single average freight burden can hide the small carts where it matters most.
The source contains delivered marketplace orders. It cannot show how many shoppers stopped before ordering or how a different threshold would change buying. Destination, seller, item weight and order mix can vary across the bands. Keep those limits with any quoted number.
Explain the fee using the actual checkout terms
If a shopper asks why shipping costs almost as much as the item, verify destination, service speed and any minimum basket rule in the actual checkout. State the two amounts and the lower-cost eligible option if one exists. Avoid assuming a threshold offer improves margin simply because it reduces the visible fee.
For a store test, track order value, freight charged, freight cost, conversion and contribution on the same assigned population. Compare smaller baskets separately and preserve a destination and service-level breakdown before changing the offer.
Study data
| Measure | Value | Context |
|---|---|---|
| All delivered orders | 89,860 orders | Original aggregate of per-order item and freight totals |
| All zero recorded freight | 334 orders | Original aggregate of per-order item and freight totals |
| All freight at least one-quarter of item price | 40,003 orders | Original aggregate of per-order item and freight totals |
| All freight at least half of item price | 14,278 orders | Original aggregate of per-order item and freight totals |
| All median freight-to-items ratio | 22.44% | Original aggregate of per-order item and freight totals |
| All median freight value | 17.09 BRL | Original aggregate of per-order item and freight totals |
| All median item price | 86.99 BRL | Original aggregate of per-order item and freight totals |
| Under R$50 delivered orders | 26,728 orders | Original aggregate of per-order item and freight totals |
| Under R$50 zero recorded freight | 0 orders | Original aggregate of per-order item and freight totals |
| Under R$50 freight at least one-quarter of item price | 24,189 orders | Original aggregate of per-order item and freight totals |
| Under R$50 freight at least half of item price | 12,115 orders | Original aggregate of per-order item and freight totals |
| Under R$50 median freight-to-items ratio | 46.73% | Original aggregate of per-order item and freight totals |
| Under R$50 median freight value | 15.1 BRL | Original aggregate of per-order item and freight totals |
| Under R$50 median item price | 29.99 BRL | Original aggregate of per-order item and freight totals |
| R$50 to under R$100 delivered orders | 25,862 orders | Original aggregate of per-order item and freight totals |
| R$50 to under R$100 zero recorded freight | 196 orders | Original aggregate of per-order item and freight totals |
| R$50 to under R$100 freight at least one-quarter of item price | 10,613 orders | Original aggregate of per-order item and freight totals |
| R$50 to under R$100 freight at least half of item price | 1,496 orders | Original aggregate of per-order item and freight totals |
| R$50 to under R$100 median freight-to-items ratio | 22.76% | Original aggregate of per-order item and freight totals |
| R$50 to under R$100 median freight value | 16.43 BRL | Original aggregate of per-order item and freight totals |
| R$50 to under R$100 median item price | 74.9 BRL | Original aggregate of per-order item and freight totals |
| R$100 to under R$200 delivered orders | 23,556 orders | Original aggregate of per-order item and freight totals |
| R$100 to under R$200 zero recorded freight | 128 orders | Original aggregate of per-order item and freight totals |
| R$100 to under R$200 freight at least one-quarter of item price | 4,161 orders | Original aggregate of per-order item and freight totals |
| R$100 to under R$200 freight at least half of item price | 555 orders | Original aggregate of per-order item and freight totals |
| R$100 to under R$200 median freight-to-items ratio | 14.27% | Original aggregate of per-order item and freight totals |
| R$100 to under R$200 median freight value | 19.12 BRL | Original aggregate of per-order item and freight totals |
| R$100 to under R$200 median item price | 139.9 BRL | Original aggregate of per-order item and freight totals |
| R$200 or more delivered orders | 13,714 orders | Original aggregate of per-order item and freight totals |
| R$200 or more zero recorded freight | 10 orders | Original aggregate of per-order item and freight totals |
| R$200 or more freight at least one-quarter of item price | 1,040 orders | Original aggregate of per-order item and freight totals |
| R$200 or more freight at least half of item price | 112 orders | Original aggregate of per-order item and freight totals |
| R$200 or more median freight-to-items ratio | 7.78% | Original aggregate of per-order item and freight totals |
| R$200 or more median freight value | 26.7 BRL | Original aggregate of per-order item and freight totals |
| R$200 or more median item price | 319.89 BRL | Original aggregate of per-order item and freight totals |
What changes when you compare the figures
| Comparison | Result | Calculation |
|---|---|---|
| All order share at or above one-quarter freight | 44.52% | = 40003 / 89860 * 100 |
| All order share at or above half freight | 15.89% | = 14278 / 89860 * 100 |
| Under R$50 order share at or above one-quarter freight | 90.5% | = 24189 / 26728 * 100 |
| Under R$50 order share at or above half freight | 45.33% | = 12115 / 26728 * 100 |
| R$50 to under R$100 order share at or above one-quarter freight | 41.04% | = 10613 / 25862 * 100 |
| R$50 to under R$100 order share at or above half freight | 5.78% | = 1496 / 25862 * 100 |
| R$100 to under R$200 order share at or above one-quarter freight | 17.66% | = 4161 / 23556 * 100 |
| R$100 to under R$200 order share at or above half freight | 2.36% | = 555 / 23556 * 100 |
| R$200 or more order share at or above one-quarter freight | 7.58% | = 1040 / 13714 * 100 |
| R$200 or more order share at or above half freight | 0.82% | = 112 / 13714 * 100 |
| Under R$50 versus R$200 or more median freight-ratio gap | 38.95 percentage points | = 46.73 - 7.78 |
| Under R$50 versus R$200 or more share at or above half freight | 44.51 percentage points | = (12115 / 26728 - 112 / 13714) * 100 |
Methodology and sources
Keep orders marked delivered and purchased from 1 January 2017 through 31 July 2018. Sum item-level price and freight_value by order_id with decimal arithmetic. Keep orders with positive total item price. Place orders into four mutually exclusive item-value bands. Divide each order’s freight by its own item value, then take the median by band. Count exact at-or-above thresholds before rounding. Separate BRL medians for item and freight are not inputs to the ratio median.
Download the source data (CSV)
Download the calculations (CSV)
Download the citation notes (CSV)
Download the evidence behind the new findings (CSV)
Related reading
Ecommerce price history statistics for identical product codes
Online discount statistics from a 314-trader pricing sweep
Shopping cart coupon statistics from Alibaba’s randomized promotion study
Equal-Value Checkout Promotions Can Get Different Responses
Check the real price before you promise two Shopify discounts
Sources and definitions
Olist, Brazilian E-Commerce Public Dataset
The source data includes the population, period, denominator and limitations for every figure.