


Quick answer
In one UCI UK online retailer’s 2011 data, 97.77% of 2,642 merchandise codes with at least 20 qualifying lines appeared at more than one paid unit price. Only 6.31% of the 412,855 eligible invoice lines were at least 10% below their own code’s modal paid price. The ledger does not identify promotions or regular advertised prices.
Key findings and sources
Nearly 98% of eligible codes had more than one paid price
Said Maybe’s UCI Online Retail replay found 2,583 of 2,642 UK merchandise codes (97.77%) with at least 20 qualifying lines appeared at multiple paid unit prices from January through November 2011.
Daqing Chen, UCI Online Retail dataset
412,855 positive UK merchandise invoice lines from one UCI online retailer, January–November 2011, restricted to 2,642 codes with 20 or more qualifying lines Count distinct penny-rounded prices per qualifying merchandise code.
Most lines fell at their own code’s modal price
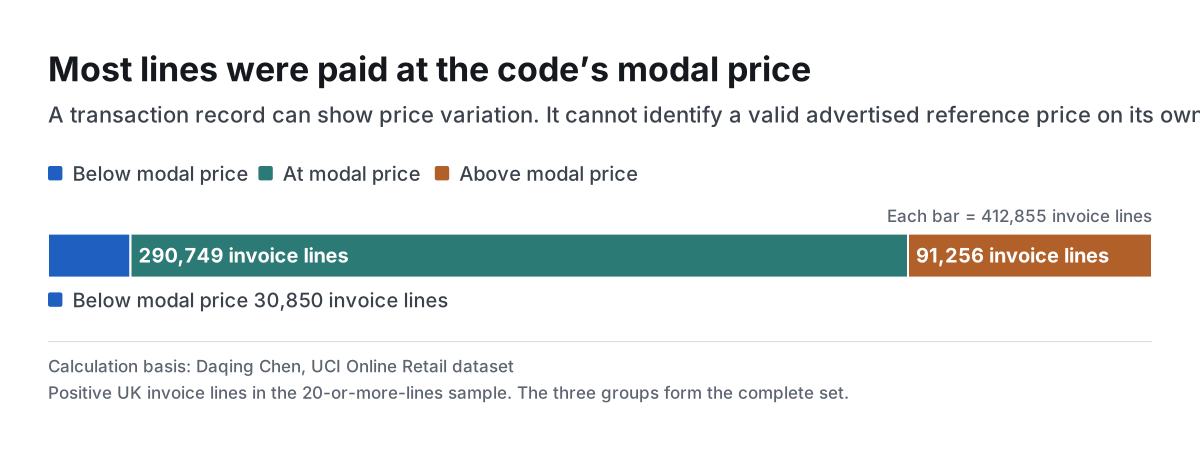
In the historical UCI sample, 290,749 of 412,855 eligible UK merchandise invoice lines (70.42%) were recorded at the most frequent paid unit price for their code.
Daqing Chen, UCI Online Retail dataset
412,855 positive UK merchandise invoice lines from one UCI online retailer, January–November 2011, restricted to 2,642 codes with 20 or more qualifying lines Compare each line’s penny-rounded paid unit price to its code-level modal price.
At least 10% below the mode occurred on 6.31% of lines
Among 412,855 eligible lines in the UCI UK online retailer sample, 26,067 (6.31%) had a paid unit price at least 10% below their code’s modal paid price. This does not identify promotions.
Daqing Chen, UCI Online Retail dataset
412,855 positive UK merchandise invoice lines from one UCI online retailer, January–November 2011, restricted to 2,642 codes with 20 or more qualifying lines Count price × 10 less than or equal to modal price × 9, using pennies.
At least 10% above the modal price was more common than the lower tail
In the same UCI invoice sample, 87,515 of 412,855 lines (21.2%) were at least 10% above their own code’s modal paid price, versus 26,067 at least 10% below.
Daqing Chen, UCI Online Retail dataset
412,855 positive UK merchandise invoice lines from one UCI online retailer, January–November 2011, restricted to 2,642 codes with 20 or more qualifying lines Compare exact integer threshold counts for high and low prices against the same line denominator.
Compare the results
Most lines were paid at the code’s modal price
A transaction record can show price variation. It cannot identify a valid advertised reference price on its own.
A repeat product code can have several legitimate paid prices
A shopper can see a different paid price for the same item because of a previous deal, order quantity, a change in standard price or another condition. The data show the price that was recorded on the invoice line. They do not record the offer wording or what price was displayed before checkout.
This sample had 2,583 eligible merchandise codes at more than one paid price. Across the 412,855 qualifying lines, 290,749 were at the code’s modal price, 30,850 were below it and 91,256 were above it. The most frequent paid price is a helpful descriptive reference rather than proof of a regular advertised price.
Separate codes from invoice lines
Counting codes answers how often the same catalog key had a variable price. Counting lines answers how often the price differed from that item’s common recorded price. Popular items generate many lines, so the two measures can look very different.
A 10% threshold helps separate more substantial price differences from a one-penny change in the ledger. The threshold still cannot show why the price changed. Compare quantity, dates, region and any recorded promotion field before claiming the shopper received a discount.
Use the actual offer record before quoting savings
When a shopper asks about a new checkout price, verify the current item, variant, eligibility, date and displayed reference price. If the only evidence is an older invoice, describe it as a past paid amount. An unsupported was-price can mislead a shopper even when both numbers are real.
For analytics, join price history to actual eligibility and offer records. Keep the lookup date and the recorded price source with each answer. That makes it possible to separate normal changes from promotions without guessing from the receipt alone.
Study data
| Measure | Value | Context |
|---|---|---|
| All qualifying codes | 2,642 codes | Original SKU and invoice-line counts |
| All qualifying invoice lines | 412,855 invoice lines | Original SKU and invoice-line counts |
| All lines at modal price | 290,749 invoice lines | Original SKU and invoice-line counts |
| All lines below modal price | 30,850 invoice lines | Original SKU and invoice-line counts |
| All lines above modal price | 91,256 invoice lines | Original SKU and invoice-line counts |
| All lines at least 10% below modal price | 26,067 invoice lines | Original SKU and invoice-line counts |
| All lines at least 10% above modal price | 87,515 invoice lines | Original SKU and invoice-line counts |
| All codes with one unit price | 59 codes | Original SKU and invoice-line counts |
| All codes with at least three unit prices | 2,256 codes | Original SKU and invoice-line counts |
| 20–49 lines qualifying codes | 666 codes | Original SKU and invoice-line counts |
| 20–49 lines qualifying invoice lines | 21,957 invoice lines | Original SKU and invoice-line counts |
| 20–49 lines lines at modal price | 15,441 invoice lines | Original SKU and invoice-line counts |
| 20–49 lines lines below modal price | 2,308 invoice lines | Original SKU and invoice-line counts |
| 20–49 lines lines above modal price | 4,208 invoice lines | Original SKU and invoice-line counts |
| 20–49 lines lines at least 10% below modal price | 2,032 invoice lines | Original SKU and invoice-line counts |
| 20–49 lines lines at least 10% above modal price | 3,717 invoice lines | Original SKU and invoice-line counts |
| 20–49 lines codes with one unit price | 44 codes | Original SKU and invoice-line counts |
| 20–49 lines codes with at least three unit prices | 429 codes | Original SKU and invoice-line counts |
| 50–99 lines qualifying codes | 670 codes | Original SKU and invoice-line counts |
| 50–99 lines qualifying invoice lines | 48,676 invoice lines | Original SKU and invoice-line counts |
| 50–99 lines lines at modal price | 33,192 invoice lines | Original SKU and invoice-line counts |
| 50–99 lines lines below modal price | 5,551 invoice lines | Original SKU and invoice-line counts |
| 50–99 lines lines above modal price | 9,933 invoice lines | Original SKU and invoice-line counts |
| 50–99 lines lines at least 10% below modal price | 5,040 invoice lines | Original SKU and invoice-line counts |
| 50–99 lines lines at least 10% above modal price | 9,334 invoice lines | Original SKU and invoice-line counts |
| 50–99 lines codes with one unit price | 12 codes | Original SKU and invoice-line counts |
| 50–99 lines codes with at least three unit prices | 568 codes | Original SKU and invoice-line counts |
| 100+ lines qualifying codes | 1,306 codes | Original SKU and invoice-line counts |
| 100+ lines qualifying invoice lines | 342,222 invoice lines | Original SKU and invoice-line counts |
| 100+ lines lines at modal price | 242,116 invoice lines | Original SKU and invoice-line counts |
| 100+ lines lines below modal price | 22,991 invoice lines | Original SKU and invoice-line counts |
| 100+ lines lines above modal price | 77,115 invoice lines | Original SKU and invoice-line counts |
| 100+ lines lines at least 10% below modal price | 18,995 invoice lines | Original SKU and invoice-line counts |
| 100+ lines lines at least 10% above modal price | 74,464 invoice lines | Original SKU and invoice-line counts |
| 100+ lines codes with one unit price | 3 codes | Original SKU and invoice-line counts |
| 100+ lines codes with at least three unit prices | 1,259 codes | Original SKU and invoice-line counts |
What changes when you compare the figures
| Comparison | Result | Calculation |
|---|---|---|
| All codes with at least three prices | 85.39% | = 2256 / 2642 * 100 |
| All share below modal price | 7.47% | = 30850 / 412855 * 100 |
| 20–49 lines codes with at least three prices | 64.41% | = 429 / 666 * 100 |
| 20–49 lines share below modal price | 10.51% | = 2308 / 21957 * 100 |
| 50–99 lines codes with at least three prices | 84.78% | = 568 / 670 * 100 |
| 50–99 lines share below modal price | 11.4% | = 5551 / 48676 * 100 |
| 100+ lines codes with at least three prices | 96.4% | = 1259 / 1306 * 100 |
| 100+ lines share below modal price | 6.72% | = 22991 / 342222 * 100 |
| All lines at least 10% below modal price | 6.31% | = 26067 / 412855 * 100 |
| All lines at least 10% above modal price | 21.2% | = 87515 / 412855 * 100 |
| All codes with more than one price | 97.77% | = 2583 / 2642 * 100 |
Methodology and sources
Keep UK invoice lines dated January through November 2011 with a noncancellation invoice, positive quantity and price, and stock code matching five digits with an optional trailing letter. Round UnitPrice to the nearest penny using Python Decimal half-even rounding. Keep codes with at least 20 qualifying lines. Find the most frequent price on each code’s lines, taking the lower price when tied. Compare each line with the modal price, using line counts rather than units, customers or orders. At-least-10% thresholds use integer penny arithmetic and are not promotion classifications.
Download the source data (CSV)
Download the calculations (CSV)
Download the citation notes (CSV)
Download the evidence behind the new findings (CSV)
Related reading
Ecommerce shipping cost statistics by basket value
Online discount statistics from a 314-trader pricing sweep
Shopping cart coupon statistics from Alibaba’s randomized promotion study
Equal-Value Checkout Promotions Can Get Different Responses
Check the real price before you promise two Shopify discounts
Sources and definitions
Daqing Chen, UCI Online Retail dataset
The source data includes the population, period, denominator and limitations for every figure.