


Quick answer
In a published demand simulation for one fashion retailer, raising the free shipping threshold and the fee below it by 50% produced 3.31% fewer orders, 4.30% larger baskets and 7.83% higher total profit than the baseline threshold. Merchandise profit rose 0.88%. For a store test, track contribution per shopper alongside basket size and completed orders.
Chen and Ngwe, Shipping Fees and Product Assortment in Online Retail, HBS Working Paper 19-034
Key findings and sources
Higher threshold, fewer orders and larger baskets
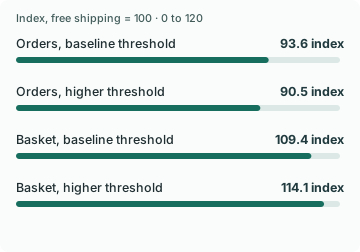
Said Maybe’s reanalysis of Chen and Ngwe’s Table 7 finds that the higher fee and free shipping threshold together produced 3.31% fewer orders and 4.30% larger baskets than the baseline threshold in the model.
Chen and Ngwe, Shipping Fees and Product Assortment in Online Retail, HBS Working Paper 19-034
Demand model for one online fashion retailer, November 2015 to October 2016 Divide 0.905 by 0.936 for orders and 1.141 by 1.094 for basket size.
The basket gain was much bigger than the merchandise revenue gain
The simulated average basket increased 4.30% from the baseline threshold to the higher one, while merchandise revenue increased 0.88% in the same single-retailer model.
Chen and Ngwe, Shipping Fees and Product Assortment in Online Retail, HBS Working Paper 19-034
Demand model for one online fashion retailer, November 2015 to October 2016 Compare each higher-threshold index with the baseline threshold index on the same row.
Merchandise profit and total profit moved at different rates
The higher shipping schedule raised modeled merchandise profit 0.88% and total profit 7.83% relative to the baseline schedule in the fashion retailer simulation.
Chen and Ngwe, Shipping Fees and Product Assortment in Online Retail, HBS Working Paper 19-034
Demand model for one online fashion retailer, November 2015 to October 2016 Divide 1.034 by 1.025 and 1.212 by 1.124, then subtract one.
Shipping revenue nearly doubled under the combined change
In Chen and Ngwe’s counterfactual, shipping revenue under the higher fee and threshold was 89.2% above the baseline threshold scenario. Both settings changed together.
Chen and Ngwe, Shipping Fees and Product Assortment in Online Retail, HBS Working Paper 19-034
Demand model for one online fashion retailer, November 2015 to October 2016 Compare the Table 7 shipping revenue index of 1.892 with the baseline index of 1.000.
Compare the results
A larger basket can come with fewer purchases
The baseline threshold charged PHP 100 below PHP 995. The higher schedule charged PHP 150 below PHP 1,492.50. Moving between those two scenarios increased average basket size by 4.30%, while order count fell 3.31%. Merchandise revenue rose only 0.88%. The average basket is measured among people who placed an order. The order count reflects people who stopped short as well.
For a merchant evaluating a checkout recovery offer, this is a reason to keep eligible shoppers in the denominator. A reminder could help a shopper add a product and still leave the offer with weaker economics if people with smaller baskets are now less likely to buy. Track how many checkout starts become paid orders before comparing what those orders were worth.
Separate merchandise margin from what shoppers pay for delivery
The higher schedule increased modeled merchandise profit by 0.88% and total profit by 7.83%. Shipping revenue was 89.2% higher than under the baseline threshold. These are different denominators, so subtracting their percentage changes cannot recover the portion of profit attributable to shipping. The direction of the results tells you what to instrument separately.
If a shopper has $54 of items and free shipping starts at $60, a $6 eligible add-on can be cheaper for that shopper than paying $7 for shipping. For the store, the same switch replaces $7 of shipping revenue with the contribution on one $6 item. Before any fulfillment or return changes, a $6 add-on with $3 of unit cost would reduce contribution by $4 for a shopper who otherwise paid for delivery. If that shopper would otherwise leave, the comparison changes to the contribution on the recovered order.
Test the threshold and the fee as distinct decisions
The paper changed the threshold and the below-threshold fee together. A merchant who needs to learn which lever mattered can hold one fixed, or randomize a sufficiently large sample across both. Use a consistent assignment unit so a returning shopper sees the same terms. Read orders per eligible shopper and net contribution per eligible shopper through a window that also accounts for typical returns.
When a conversation surfaces the offer, quote the eligible subtotal and remaining amount as calculated by checkout. Discount rules, destination exclusions and split fulfillment can change eligibility. Compare the final charged amount with the amount shown in the message, and capture the order result even if the shopper finishes without replying.
Study data
| Measure | Value | Context |
|---|---|---|
| Order count, baseline shipping threshold | 93.6 index | Published normalized scenario output, rescaled to 100 |
| Order count, higher shipping threshold | 90.5 index | Published normalized scenario output, rescaled to 100 |
| Average order size, baseline shipping threshold | 109.4 index | Published normalized scenario output, rescaled to 100 |
| Average order size, higher shipping threshold | 114.1 index | Published normalized scenario output, rescaled to 100 |
| Merchandise revenue, baseline shipping threshold | 102.4 index | Published normalized scenario output, rescaled to 100 |
| Merchandise revenue, higher shipping threshold | 103.3 index | Published normalized scenario output, rescaled to 100 |
| Merchandise profit, baseline shipping threshold | 102.5 index | Published normalized scenario output, rescaled to 100 |
| Merchandise profit, higher shipping threshold | 103.4 index | Published normalized scenario output, rescaled to 100 |
| Total profit, baseline shipping threshold | 112.4 index | Published normalized scenario output, rescaled to 100 |
| Total profit, higher shipping threshold | 121.2 index | Published normalized scenario output, rescaled to 100 |
| Shipping revenue, baseline shipping threshold | 100.0 index | Published normalized scenario output, rescaled to 100 |
| Shipping revenue, higher shipping threshold | 189.2 index | Published normalized scenario output, rescaled to 100 |
| Baseline below-threshold fee | 100 PHP | Scenario input |
| Baseline free shipping threshold | 995 PHP | Scenario input |
| Higher below-threshold fee | 150 PHP | Scenario input |
| Higher free shipping threshold | 1,492.5 PHP | Scenario input |
What changes when you compare the figures
| Comparison | Result | Calculation |
|---|---|---|
| Orders lost per 100 baseline-threshold orders | 3.31 orders per 100 | = (1 - 0.905 / 0.936) * 100 |
| Average basket change, higher versus baseline threshold | 4.3% | = (1.141 / 1.094 - 1) * 100 |
| Merchandise revenue change, higher versus baseline threshold | 0.88% | = (1.033 / 1.024 - 1) * 100 |
| Merchandise profit change, higher versus baseline threshold | 0.88% | = (1.034 / 1.025 - 1) * 100 |
| Total profit change, higher versus baseline threshold | 7.83% | = (1.212 / 1.124 - 1) * 100 |
| Shipping revenue change, higher versus baseline threshold | 89.2% | = (1.892 / 1.0 - 1) * 100 |
Methodology and sources
We rescaled the published Table 7 indices to a base of 100 for the exhibit, and divided the higher scenario by the baseline threshold scenario for the comparisons. Table 7 benchmarks shipping revenue against the baseline threshold and other figures against free shipping. Ratios stay within the same row. Scenario outputs reflect rounded source values. The study jointly raises the fee and threshold and does not identify the effect of either change on its own.
Download the source data (CSV)
Download the calculations (CSV)
Related reading
Online discount statistics from a 314-trader pricing sweep
Shopping cart coupon statistics from Alibaba’s randomized promotion study
Equal-Value Checkout Promotions Can Get Different Responses
Countdown timer statistics and how to verify an ecommerce offer
Check the real price before you promise two Shopify discounts
Sources and definitions
Chen and Ngwe, Shipping Fees and Product Assortment in Online Retail, HBS Working Paper 19-034
The source data includes the population, period, denominator and limitations for every figure.